Geological Time Chart
Sea Level Changes over Different Time Periods
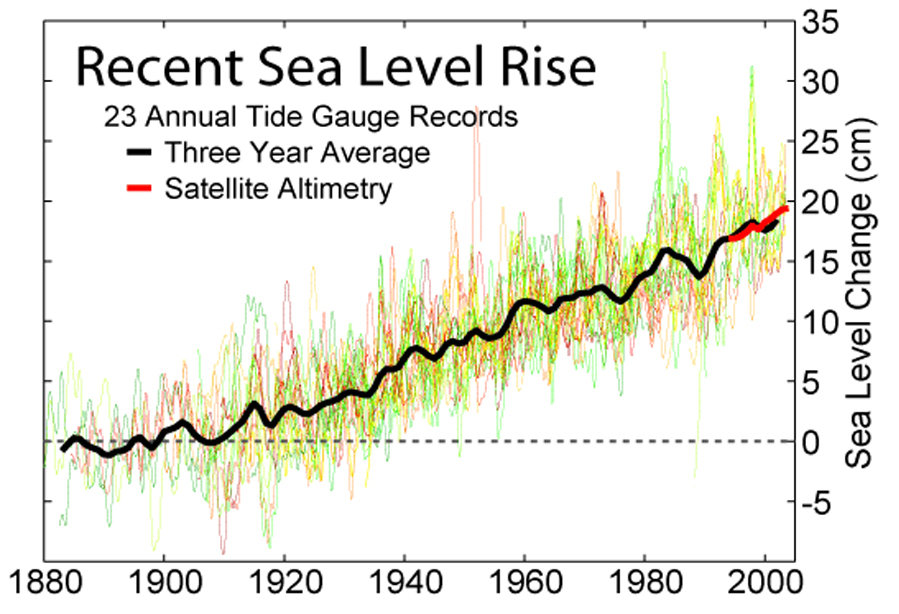
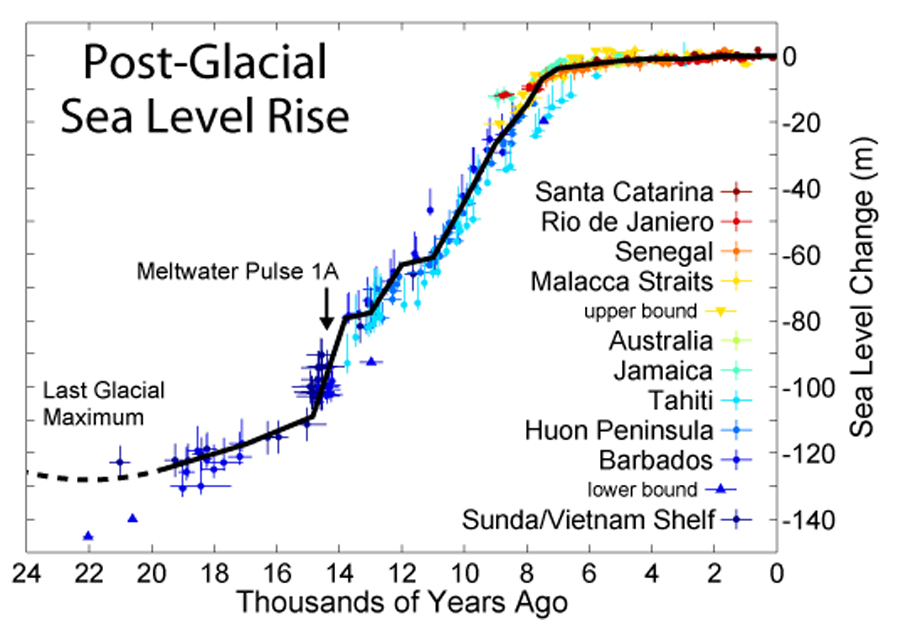
The charts below show recent increases in sea level as well as fluctuations over different time periods (125 years, 24k years, 500k years and 542 million years).
From - Wikipedia, Sea Level
From - Wikipedia, Sea level rise
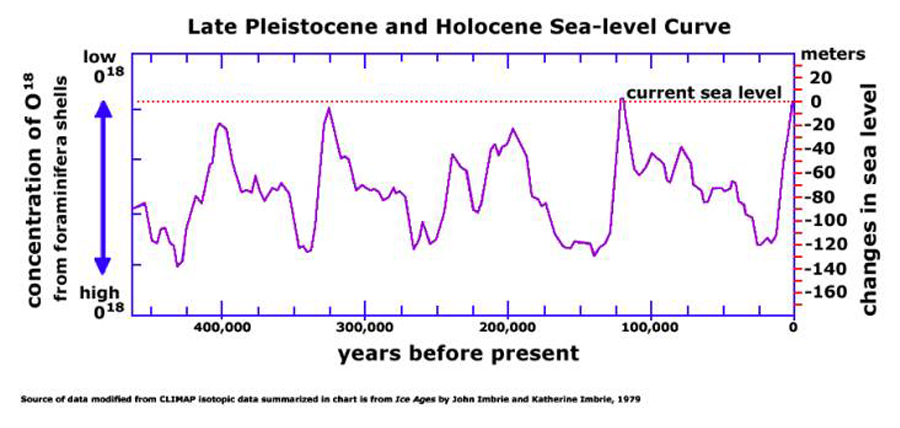
Modified from CLIMAP Isotopic data summarized in chart from Ice Ages by John Imbrie and Katherine Imbrie, 1979
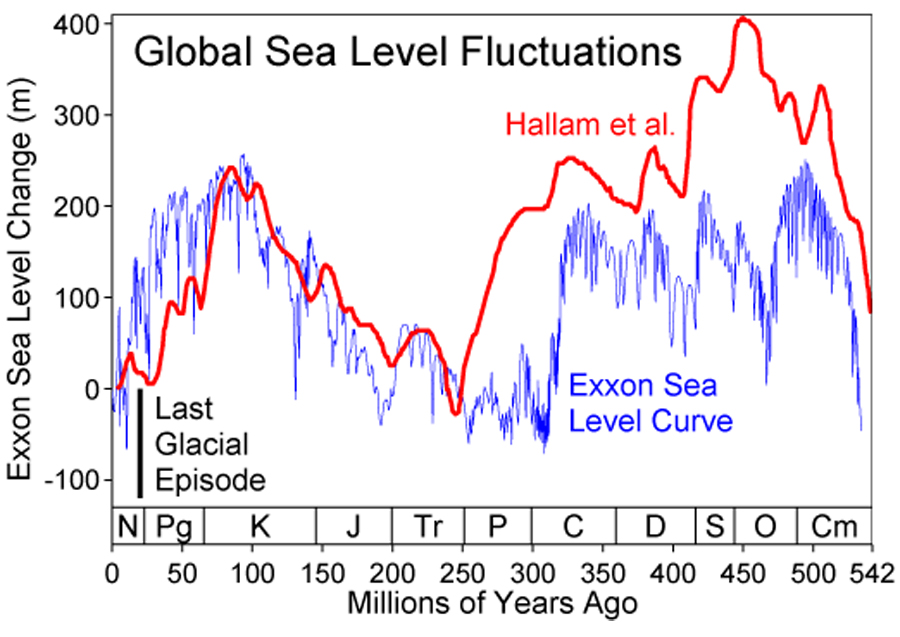
From - File:Phanerozoic Sea Level.png by Robert A. Rohde
References:
Wikipedia, 2015, Sea Level Rise
Robert A. Rohde, 2015 File: Phanerozoic Sea Level.ping
Imbrie, j., Imbrie, k., 1979, Ice ages, MacMillan
Copyright © 2007-2022 geologicaltimechart.com. All Rights Reserved.